RangeUS is a special chart that filters out market noise, and candlesticks are built based on the distance traveled. Such a schedule does not depend on time or volume.
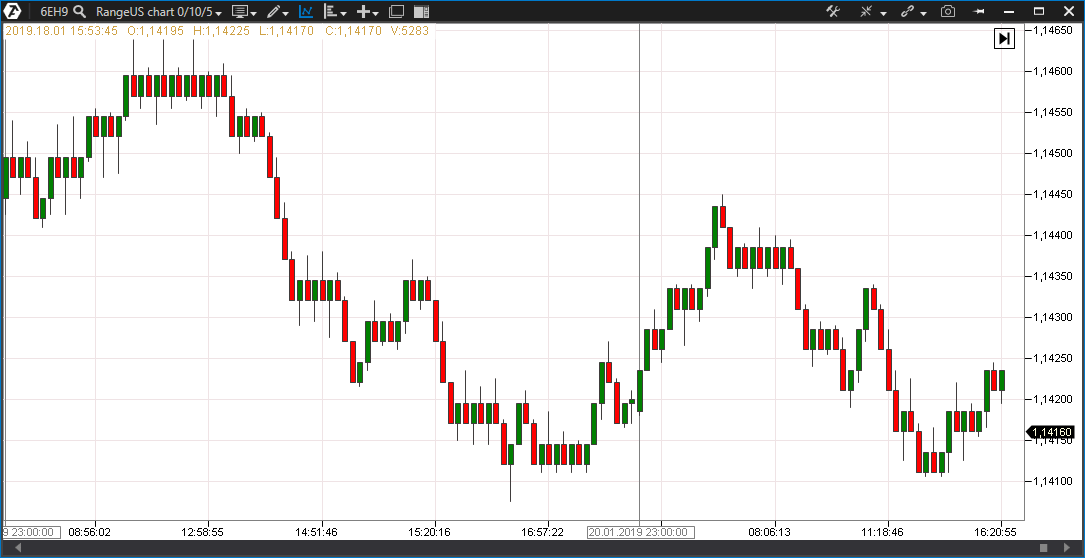
Example of the RangeUS chart on futures 6E:
The principle of building of candles RangeUS:
The RangeUS chart consists of two types of candles:
- Trending
- Reversible
When building use three parameters:
- Open Offset - a shift from the beginning of the session, from which the drawing of the first candlestick starts. The use of this parameter affects the entire graph as a whole, since it shifts rigid boundaries.
- Tick Trend - is the distance at which a trend candle will be formed and closed. The distance is counted up or down.
- Tick Reversal - is the distance at which the reversing candle will be formed and closed. A prerequisite for closing is the price movement in the opposite (opposite) direction to the previous candlestick.
The figure shows an example of building RangeUS with parameters: Tick Trend - 10 and Tick Reversal - 5, for futures 6E.
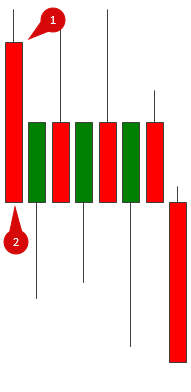
Between the marks 1 and 2 in the figure there is a trend candle measuring 10 points in price. At point 1, an opening occurred, at point 2 - closing. Short candles with shadows are Tick Reversal, i.e. reversible (reversal) candles.
On the charts of RangeUS (as well as on the classic Japanese candlestick charts) candles may have shadows, but they are always directed against the candle itself. In other words, a shadow on a descending red candle is possible only from above, on an ascending green one - from below, and nothing else. This rule is relevant only for formed candles. If the closure has not happened yet, the shadows can be in any direction.

In the following picture, between remarks 1 and 2, there is a reversing candle, the size of which is 5 ticks. At point 2, an opening occurred, at point 1 - a close, but the price moved to point 3, which affected the formation of a long shadow.
Reversal candle formed as a rising. This means that the price has passed 5 ticks in the opposite direction from the close of the previous trend candle. Despite the fact that the candle in this example has a long shadow from below, the price did not overcome the 10-tick mark and returned higher. By this principle, reversing candles are formed.

If a trend candle has already been formed, and the price continues moving for 10 ticks in the same direction, then the next trend candle is formed (as in the figure on the left)
With certain settings that are individual for different instruments, the RangeUS chart will hide unnecessary market noise and show important support and resistance levels.
Was this article helpful?
That’s Great!
Thank you for your feedback
Sorry! We couldn't be helpful
Thank you for your feedback
Feedback sent
We appreciate your effort and will try to fix the article