To open the settings, click on the icon in the chart menu panel. The visual settings panel will open on the left.
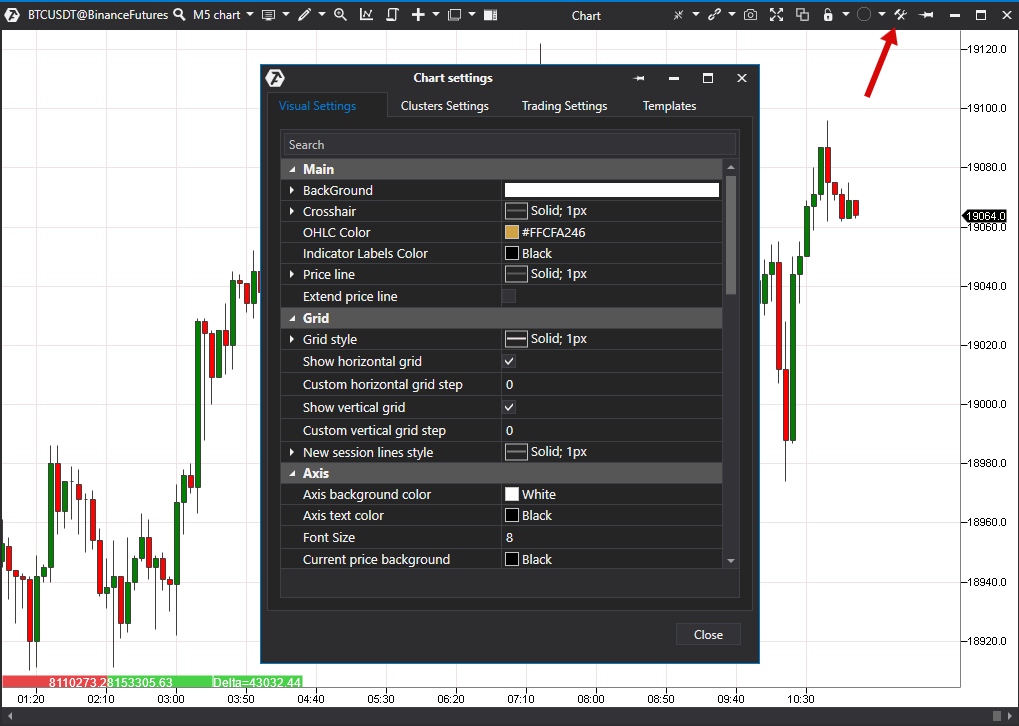
Visual Settings
0.Search.
1.Main.
BackGround – color setup of the background.
CrossHair – color of the mouse crosshair.
OHLC Color (open, high, low, close) – color setup of the opening, closing, high, and low price pointers, which is displayed in the left corner when pointing the mouse to the price area on the chart.
Price line – the current price line color.
Indicator Labels Color.
Extended price line.
2.Grid.
Grid color.
Show horizontal grid.
Custom horizontal grid step – setting of the price step display.
Show vertical grid.
Custom vertical grid step – setting of the time step display, calculated in minutes.
New session line style – style of the session separating line.
3.Axis.
Axis background color.
Axis text color – color of the text on the axis.
Font Size.
Current price background.
Current price foreground.
Time Format - setting of the time format on the time scale (below the chart). There are 6 possible settings:
Auto
YearMonthDay
DayMonthYearHourMinSec
HourMin
HourMinSec
HourMinSecMilliSec
Hide price axis.
4.Candles.
Up candle color – color of upward candles.
Down candle color – color of downward candles.
Draw Candle border – display candle borders.
Candles border – color setup of candle borders.
Candle border width – setup of the candle border width.
5.Bars.
Bar width – setup of the bar width.
Doji color.
Down bar color.
Up bar color.
Show open – display the opening price.
Show close – display the closing price.
6.Line chart parameters.
Color.
7.Area chart parameters.
Color.
Background.
8.Session Time.
Custom Session Time – when this option is enabled, you can manually set up the session opening and closing time.
Session begin – custom settings of the session opening.
Session end – custom settings of the session closing.
9.Other.
Crosshair border mode – highlight the price above and below.
Indicators values on mouse over – the option of turning on/off circles with values on indicators when the mouse is over.
Auto transform candles to clusters – if this option is enabled and candles are stretched, they will transform into clusters.
Candle width to auto transform.
Hide clusters panel.
Auto transform horizontal lines – if this option is enabled, horizontal lines will be automatically scaled to the whole cluster size when switching to a cluster chart.
Auto transform vertical lines – if this option is enabled, vertical lines will be automatically scaled to the whole bar size when switching to a cluster chart.
Priсe offset.
Chart vertical offset.
Smoothing – the following option allows to smoothen the sharpness of the chart, which, in turn, reduces the eye fatigue.
Mouse wheel behavior:
Zoom.
Scroll.
Volume visualization
Minimize volume values - minimizes volume values, e.g. the value of12345will be shown as12k .
Digits after the decimal point - set the number of digits after the decimal point
10. Drawing objects
Keep selected objects.
Highlight color.
Magnet sensitivity, pixels.
Was this article helpful?
That’s Great!
Thank you for your feedback
Sorry! We couldn't be helpful
Thank you for your feedback
Feedback sent
We appreciate your effort and will try to fix the article