By default, the ATAS platform opens a candlestick charthowever, you can also choose any template from 6 chart display modes by using one of the following options:
1. Left-click on the icon on the chart menu bar and select the desired display mode in the pop-up menu.
2. Use the context menu by right-clicking on the chart and select the desired display mode in the pop-up menu.
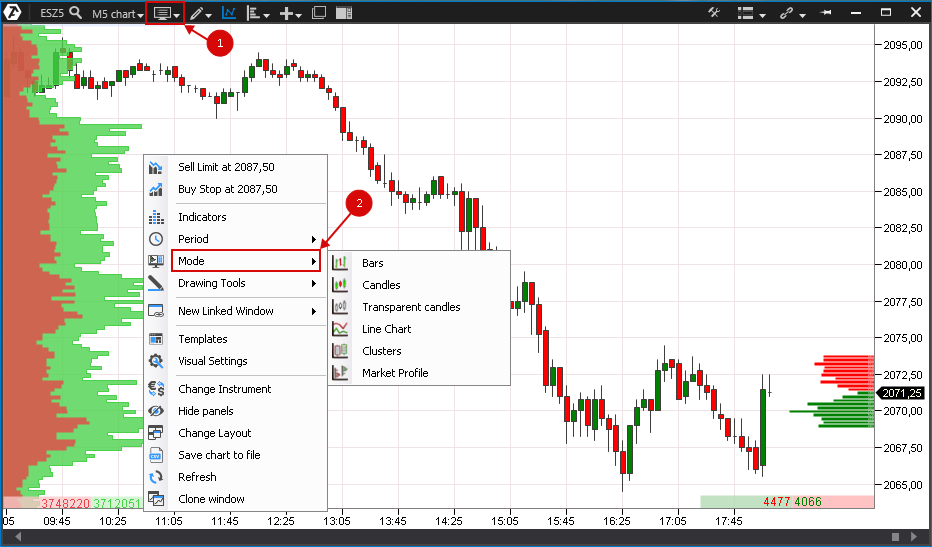
Let us consider these modes in more detail.
Bars and candles are standard charts for the classical analysis. They are built on the basis of four data types (closing, opening, highs and lows of a range). Bars differ from candles only in their appearance.
Bars.
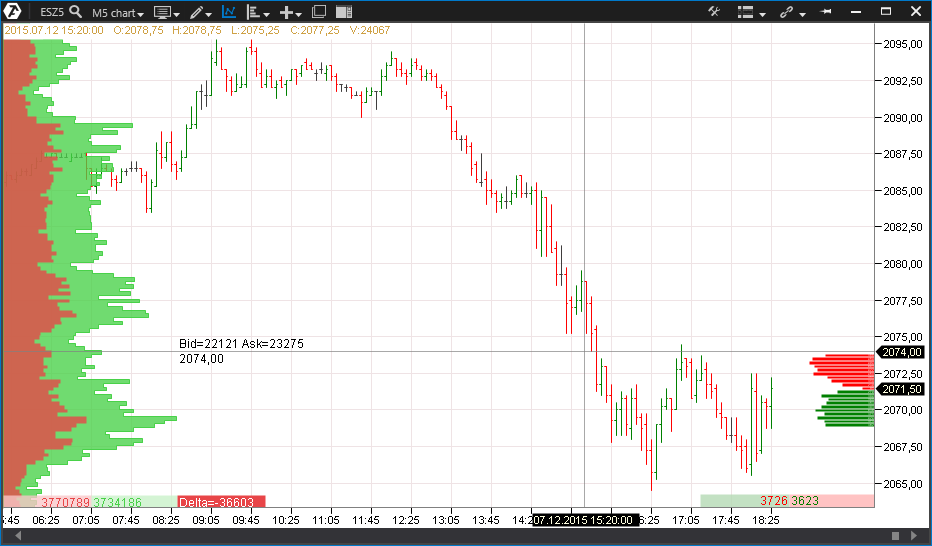
Candels
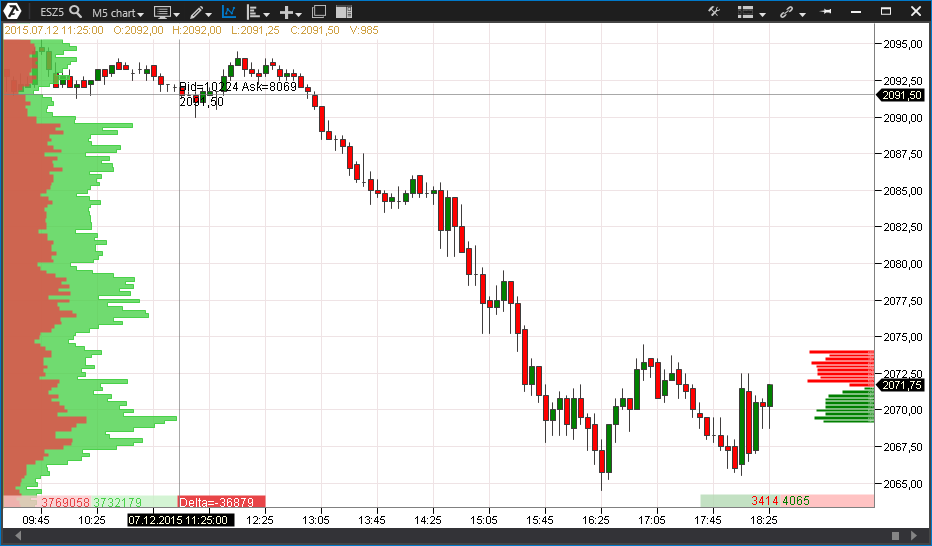
Transparent Candles
They are a type of candles whose main feature, as suggested by the name, is transparency. It is often necessary to add multiple indicators and drawing objects to the chart. To avoid cluttering the chart with too many colors, this chart mode is used for clarity.
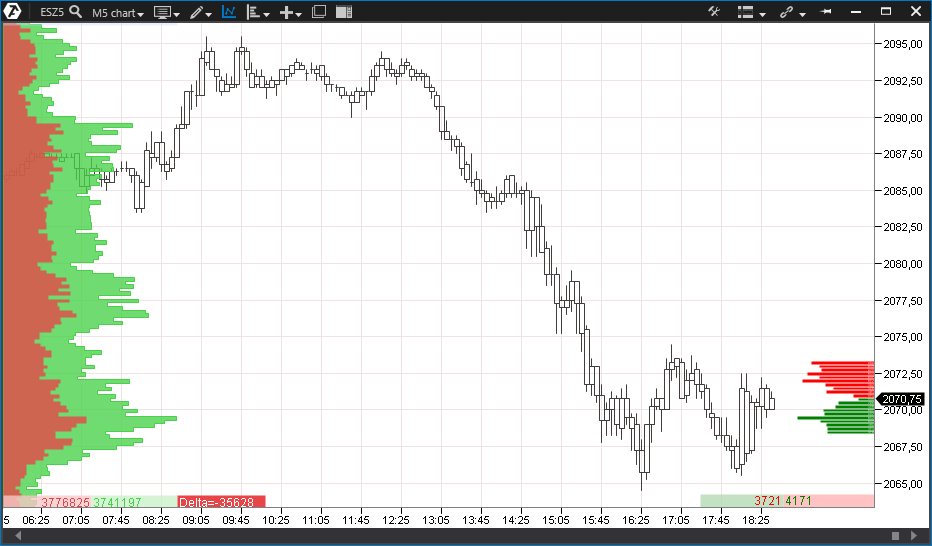
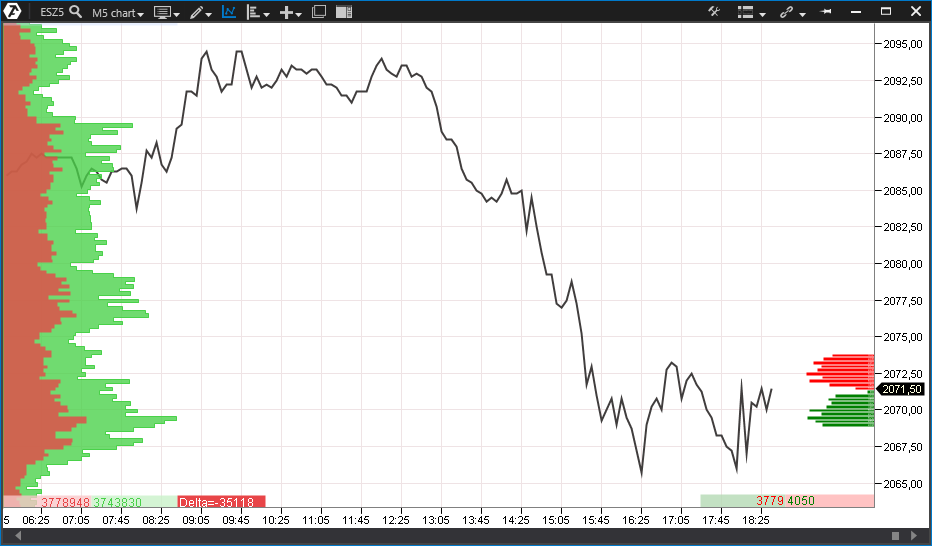
Line Chart
This is the easiest chart to build, and it is based on the closing price of the selected range. This chart carries very little information content but is convenient for displaying general trends, especially over an extended period of several months or even years.
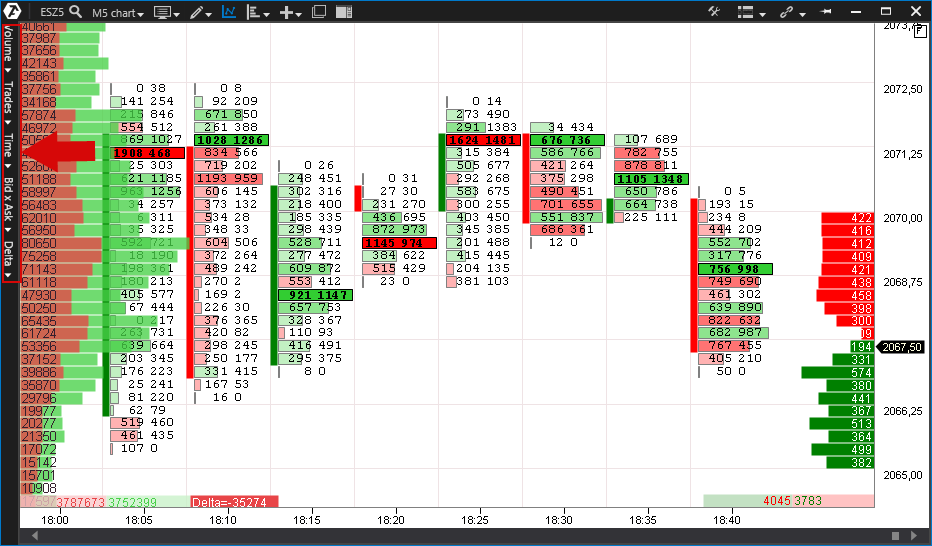
Clusters are the relatively new type of analytical chartsin the west, this stock information display mode is called the Footprint chart. Clusters represent digital or graphical display of data on performed sells and buys inside each bar at every price level.
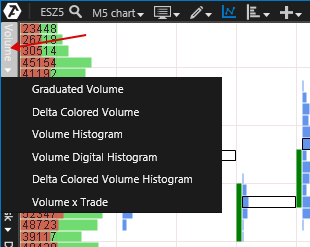
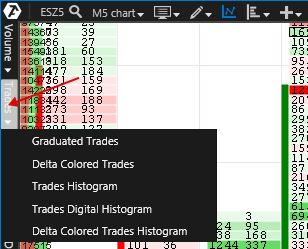
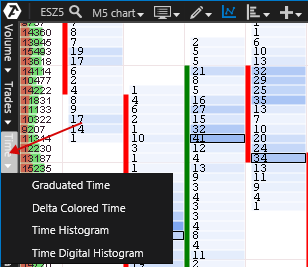
Please note that the cluster display mode features an additional vertical menu on the left of the chart window with various options for the display of clusters:
Volume
Time (in seconds)
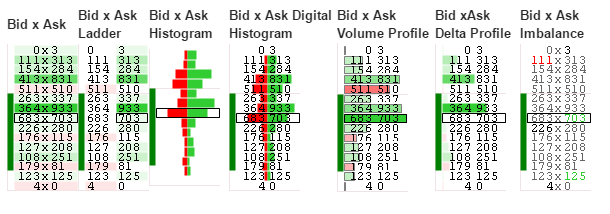
Bid x ask: bids and asks separately
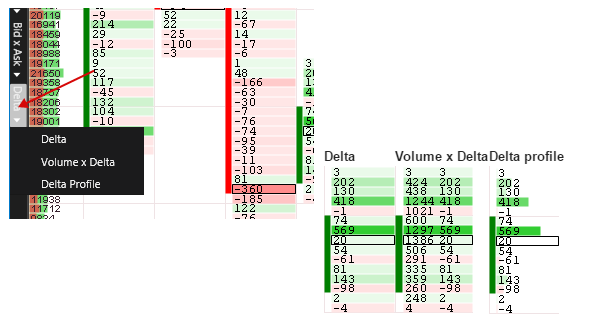
Delta: the difference between bids and asks
Let us consider cluster chart display options:
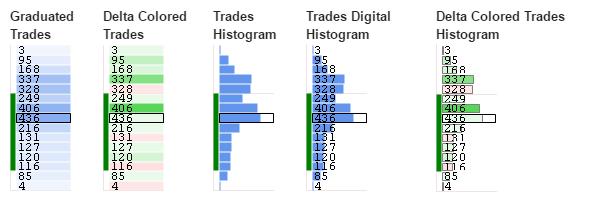
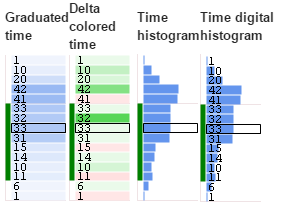
Below are examples of displaying these cluster chart settings options.
Volume.
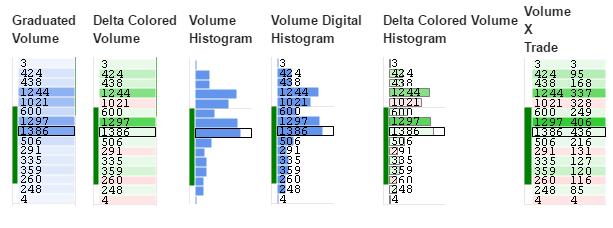
Trades
Time.
Bid/Ask.
Delta.
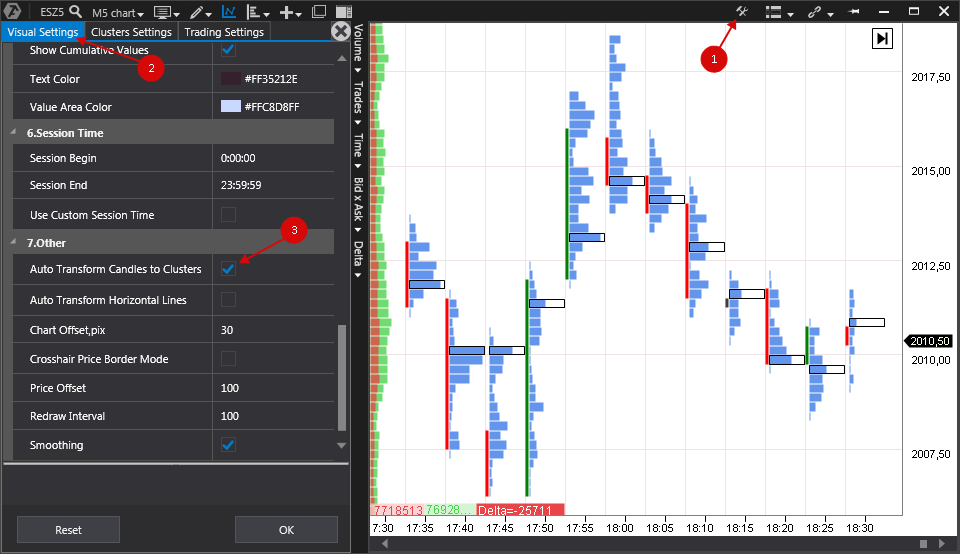
Please note that the cluster view of the chart will automatically switch to a candlestick chart when the chart is scaled down. While this feature is convenient, it can be disabled if needed by accessing the settings.
To disable this option:
1. Click on the settings icon.
2. In the settings window that opens to the left, select the Visual Settings tab.
3. After that, uncheck in the Auto Transform Candles to Clusters box in the Other section.
*You can find more information about chart settings here:
Also read the following article on the topic:
Was this article helpful?
That’s Great!
Thank you for your feedback
Sorry! We couldn't be helpful
Thank you for your feedback
Feedback sent
We appreciate your effort and will try to fix the article