Unlike Delta that shows the standard view of the difference, Bid/Ask Imbalance allows you to automatically highlight the imbalance of market buys and sells in each specific spread.
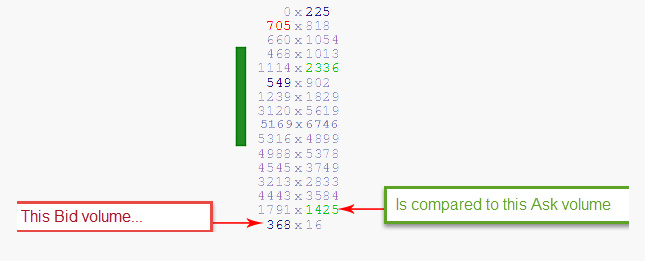
It uses a variation and compares the bid traded volume of one price to the ask traded volume of the price located directly above. It then employs an algorithm that compares the ratio of volume between the two. The main goal is to automatically highlight imbalances between the volume traded at the price being offered and the volume traded at the price being bid. It always compares the bid price to the ask price above and shows a relative ratio.
For example, let s analyze the value of 30 ask and the value of the overweight of 350%, 350% of 30 = 105, in order for the cluster to be highlighted, the bid must be more than 105.

The imbalance value is calculated as a percentage of the compared volumes. This value is 150% by default, but if you increase it, e.g. up to 300%, a more substantial imbalance will be highlighted. To change the parameter, go to settings on the cluster chart, choose Cluster Settings tab and set the required Imbalance Rate value as shown in the picture.
Settings of the Bid/Ask Imbalance mode:
- Enabled - enable/disable the mode
- Bid color - select the color of the highlighted bids
- Ask color - select the color of asks
- Overweight, % - set the overweight value in percent
The optimal size of this parameter depends on the liquidity of the analyzed instrument and the time frame you have chosen for the chart.
- Volume filter - set the minimum volume for highlighting Bid and Ask
- Minimum difference - set the minimum difference between Bid and Ask
- Ignore zero values
As a result of the calculation, the indicator highlights two numbers located diagonally:
1) If the lower price bid is higher by Imbalance Rate percent than the upper price ask, then the bid is highlighted in red.
2) If the upper price ask is higher by Imbalance Rate percent than the lower price bid, then the ask is highlighted in green.
Also read the following articles on this topic:
GETTING ACQUAINTED WITH ATAS. ADVANTAGES OF WORKING WITH INDICATORS
CANDLESTICK PATTERNS. HOW TO IMPROVE THEIR ACCURACY
WHAT IS BID, ASK AND SPREAD IN TRADING
IMBALANCE: TRADE ON THE SIDE OF SUPERIOR FORCES
SEARCHING FOR CANDLES PATTERNS AND CLUSTERS ON M5 CHART
Was this article helpful?
That’s Great!
Thank you for your feedback
Sorry! We couldn't be helpful
Thank you for your feedback
Feedback sent
We appreciate your effort and will try to fix the article